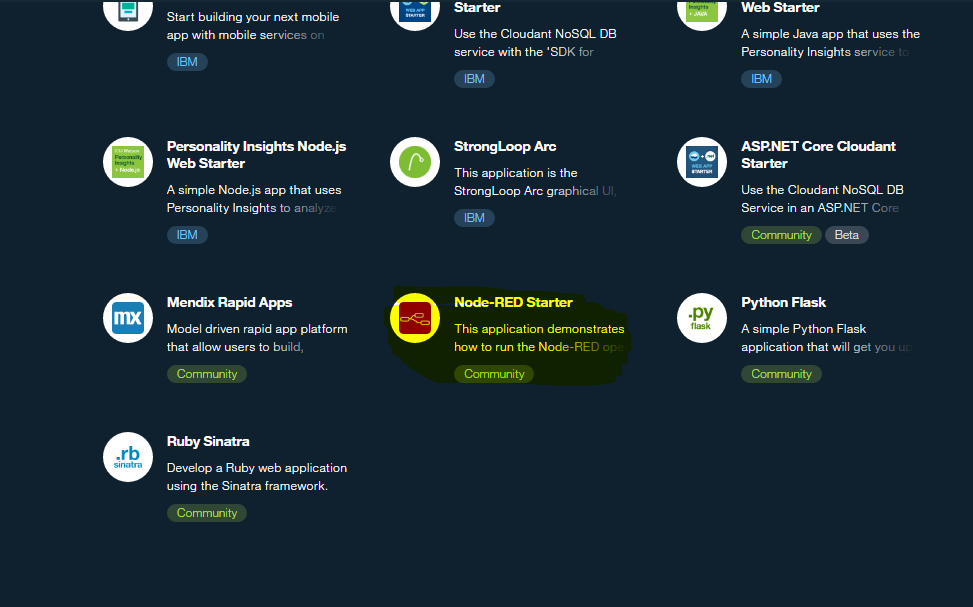
Let’s do say hello with Node-RED Starter and have a look at creating some basic workflows. From our bluemix catalog, simply go to the Boilerplates category. From there, in Boilerplates, simply select the Node-RED Starter;
Now simply enter your credentials and click Create to begin staging the boilerplate app.
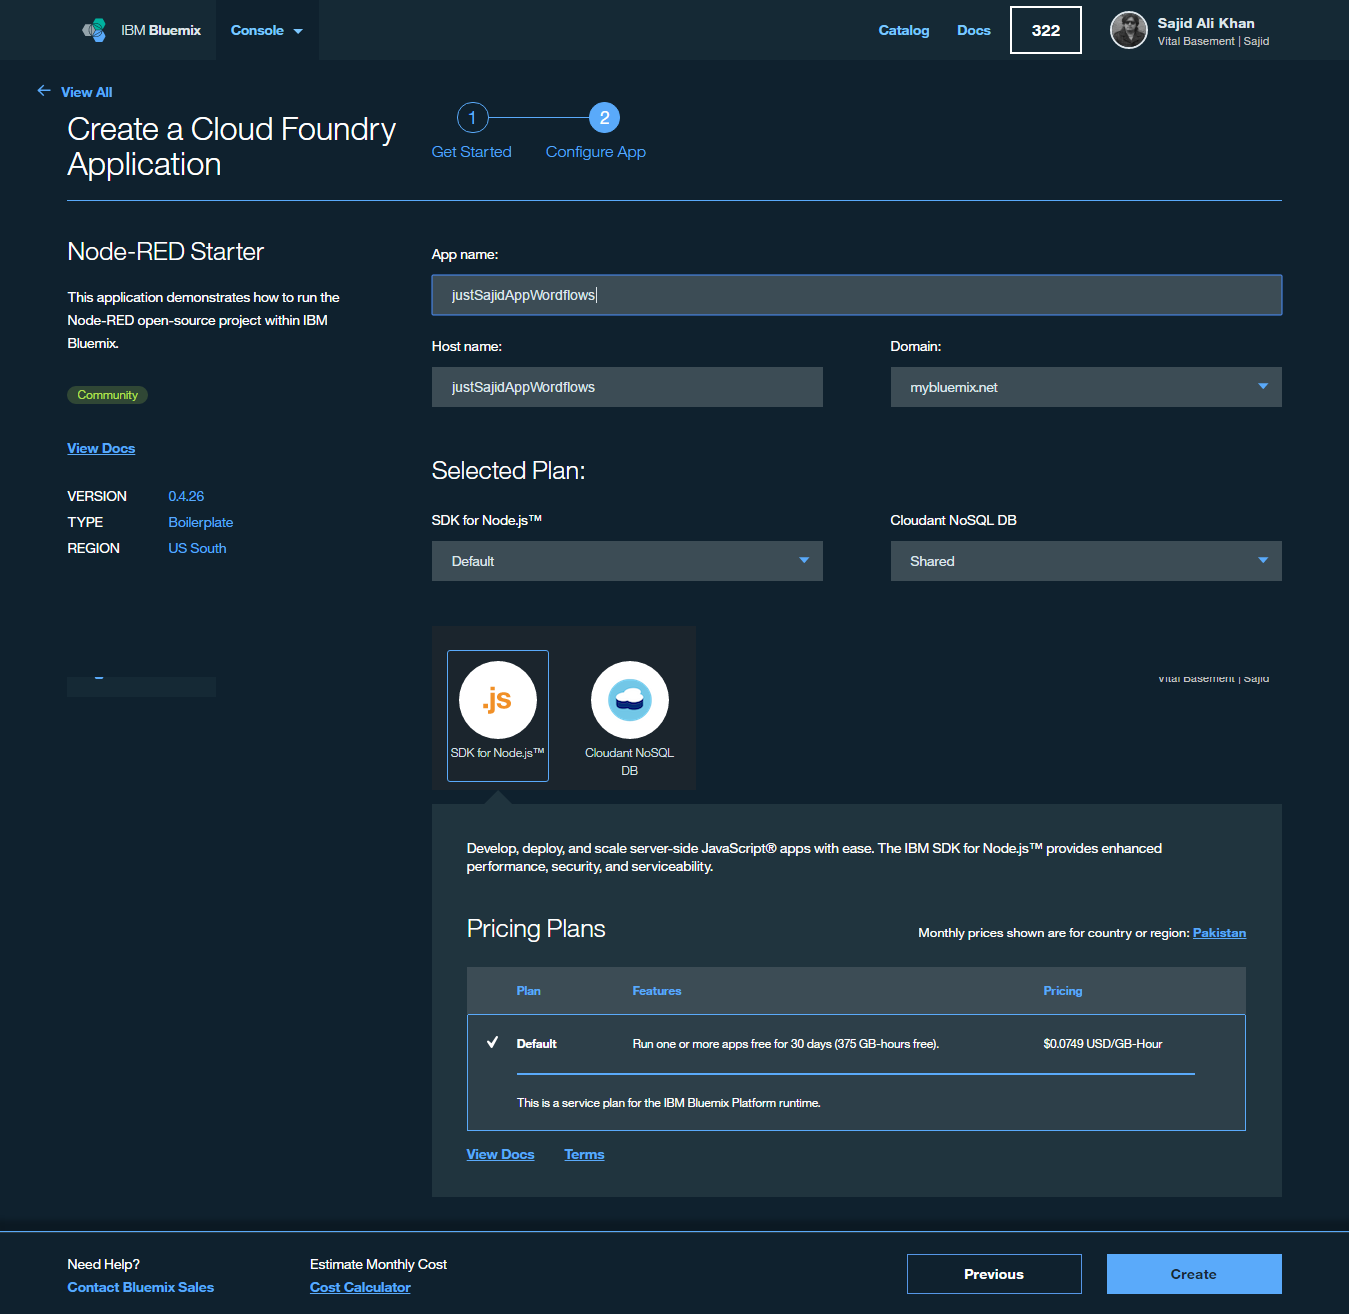
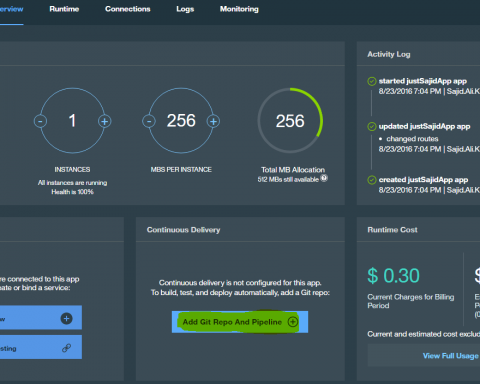
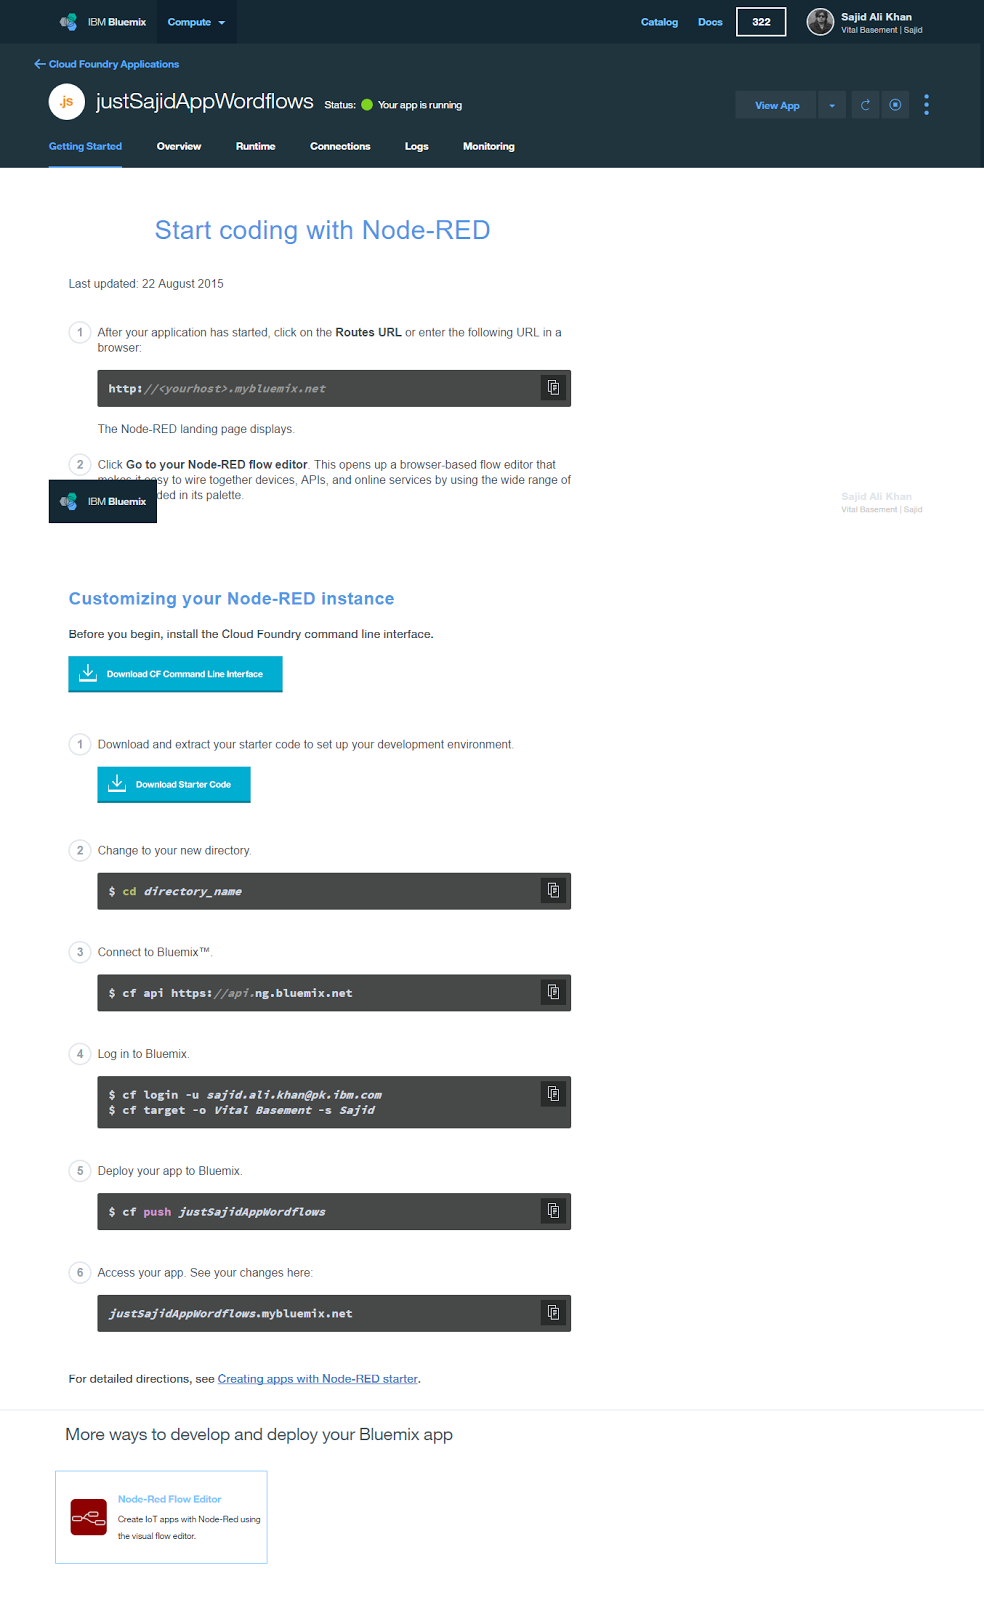
Staging is now complete and the app is running under the host name provided;
First Look at Node-RED Workflows
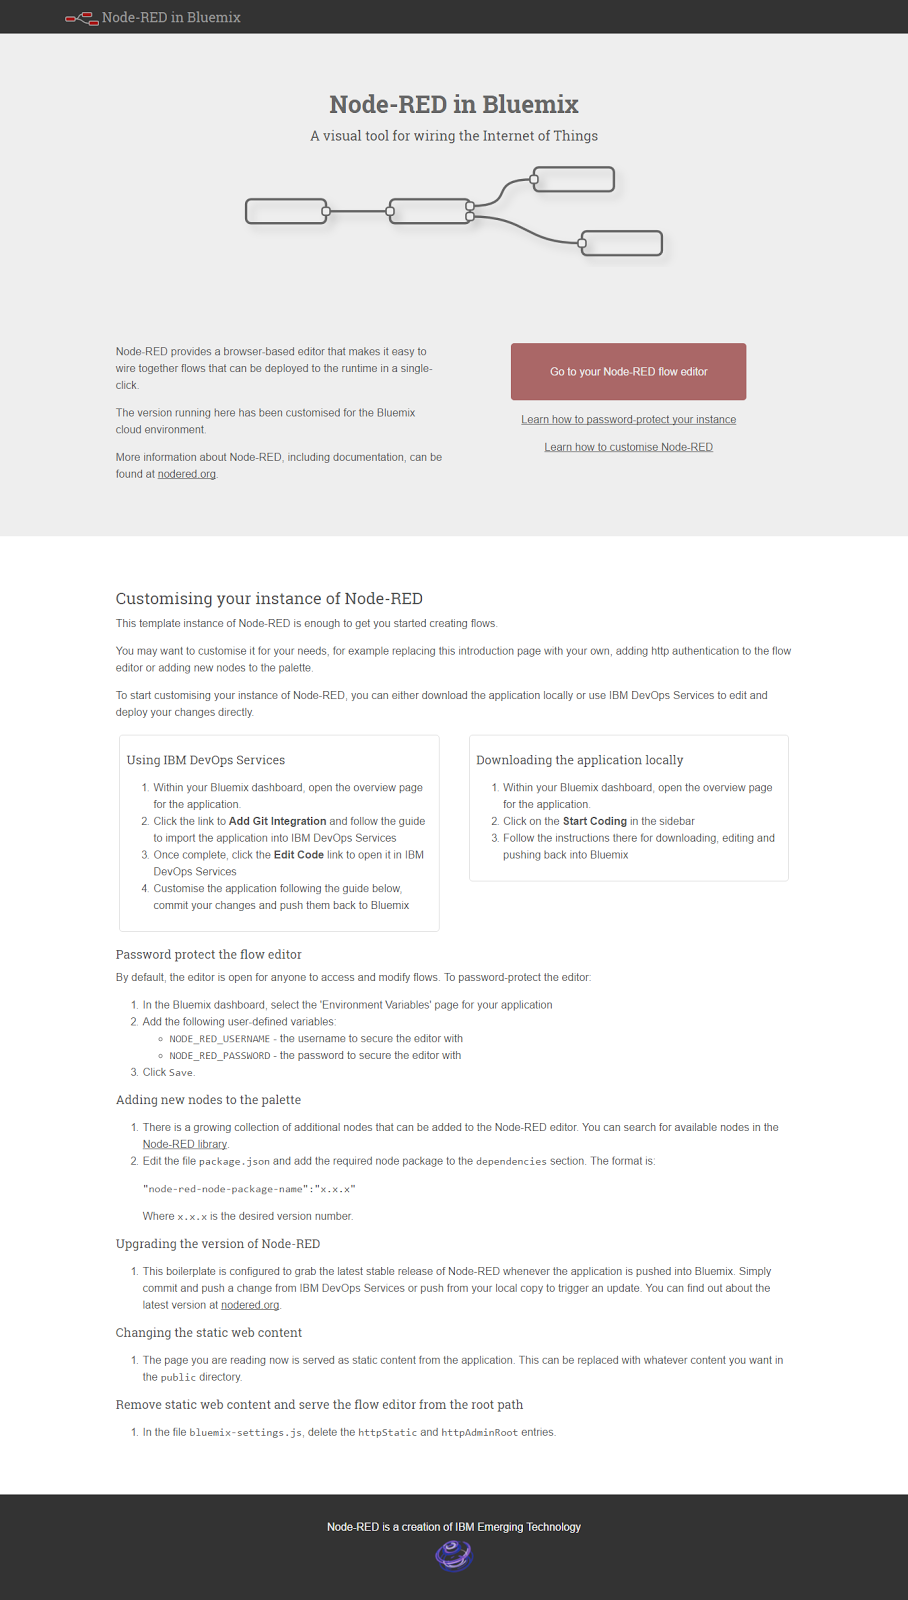
To launch our Node-RED application, we can simply click on the URL. We are now on the Node-RED landing page and the first thing you will notice is the description, A visual tool for wiring the Internet of Things;
Node-RED is a fantastic entry point for exploring some of the services available on IBM Bluemix and trying out or brainstorming ideas very quickly without having to worry about any plumbing code. This is just one of many different ways that you can leverage and interact with Bluemix and others will be demonstrated throughout this course.
To start building our first workflow, we can click on Go to your Node-RED flow editor;
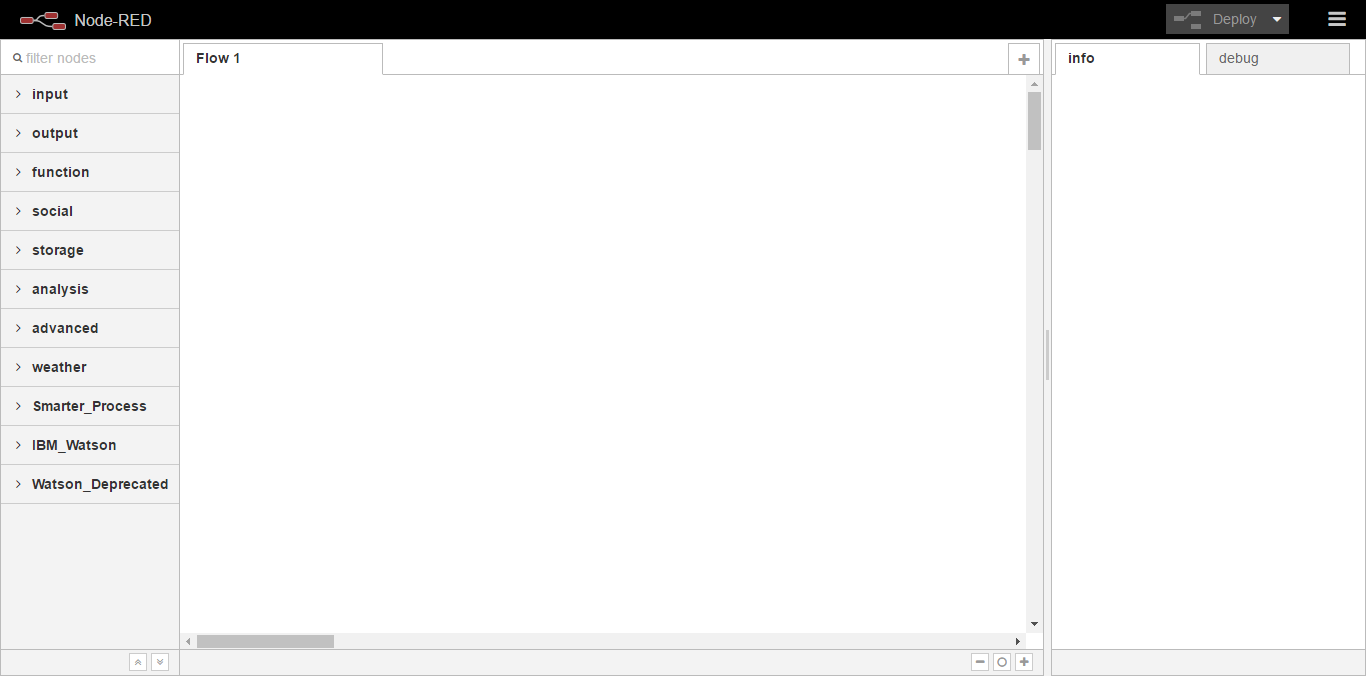
Now that our editor has loaded I’m just going to highlight some of the key features;
- In the center we have our workspace, this is where we will drag and configure nodes.
- On the right we have tabs for info on a selected node or debug, where we can output messages from our workflows or identify issues.
- At the top we have a button which will allow us to deploy our workflows when they are ready.
- And finally, on the left-hand side, we have the series of nodes available. We have nodes for input, which will allow us to capture data into our workflows. This may be for a HTTP request, websockets, or even from devices on censors when building an IOT application.
There are nodes to push data back out from our workflow. Functions to manipulate data. We have social, storage, analysis, and finally IBM watts and nodes. We will cover these in more detail throughout the course.
To get started building our first basic workflow we can simply click and drag a node. We will start with the inject node, click and drag onto the workspace;
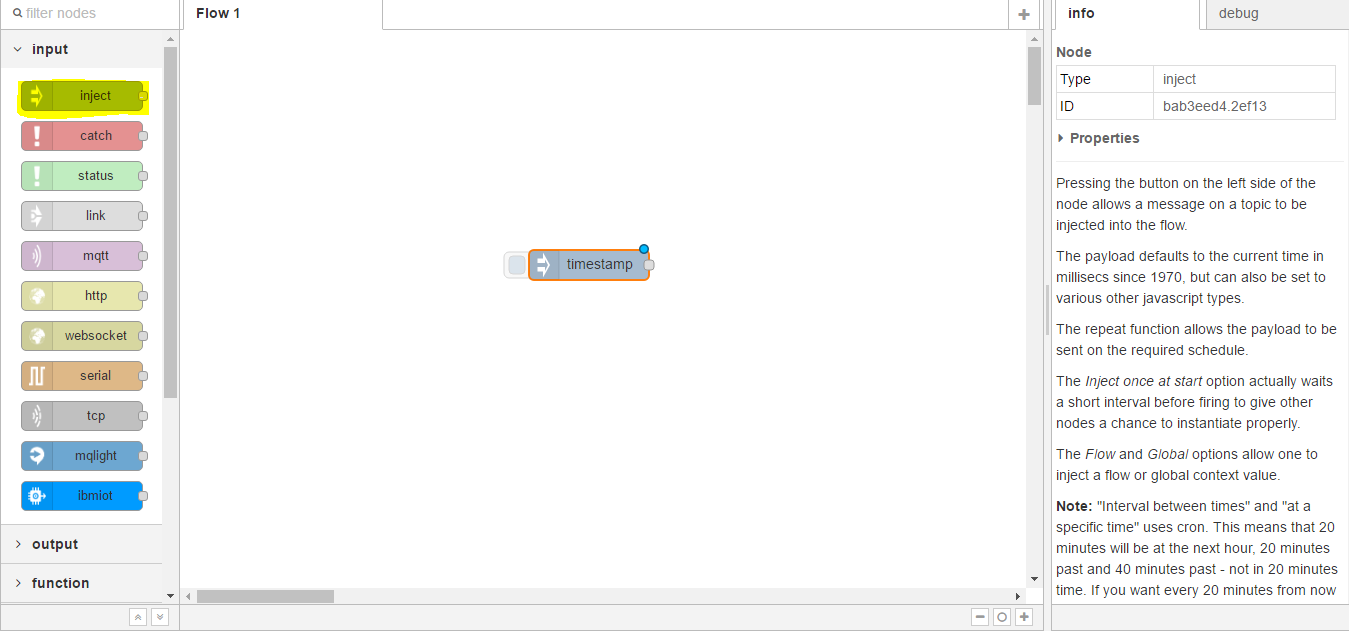
The inject node is very useful if you just want to test the flow of data through any connected nodes.
Next, we will provide an output and in this case, we will select debug, click and drag;
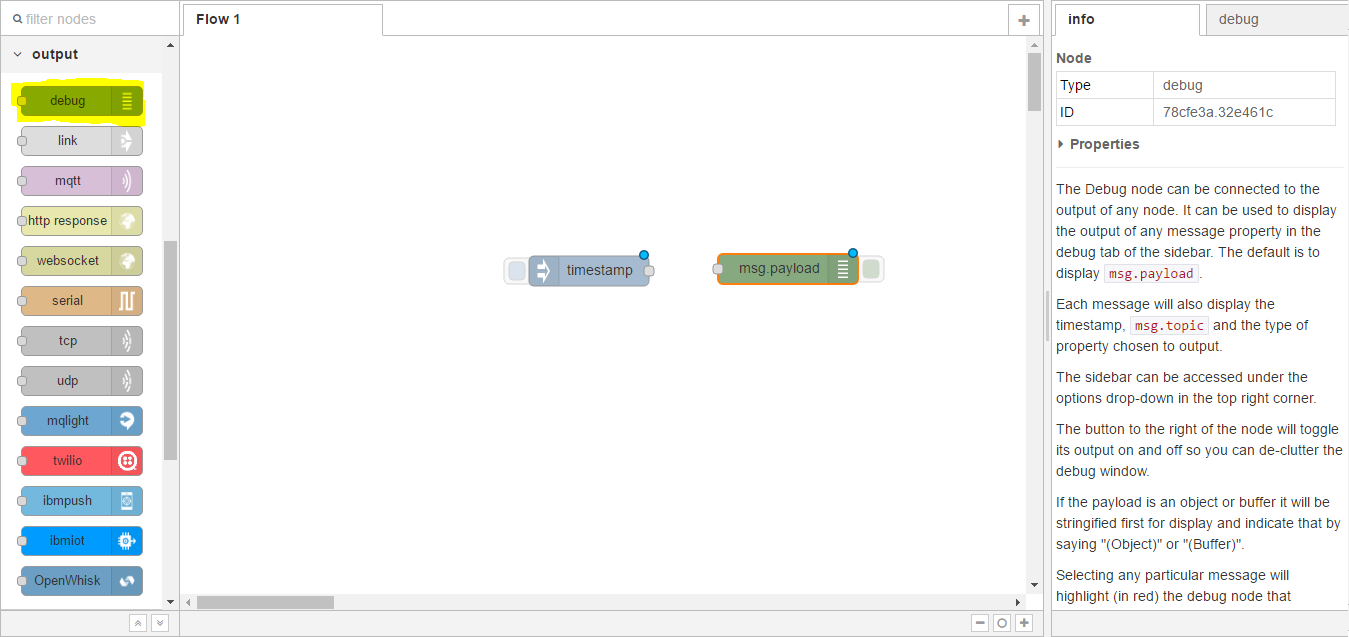
Debug is very useful, as it will display any message data that is sent to the node.
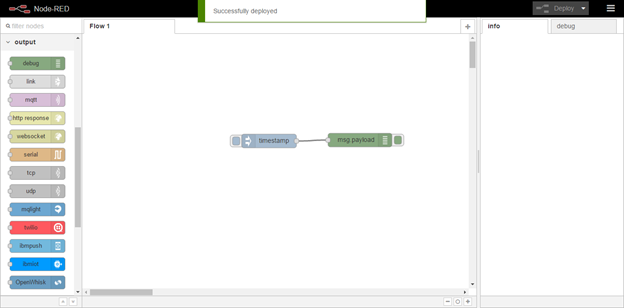
You can see the little blue icon at the top of each of the nodes and this denotes a change has been made to the workflow but has not yet been deployed. To link two nodes together, you can click on the little connector and drag between two nodes;
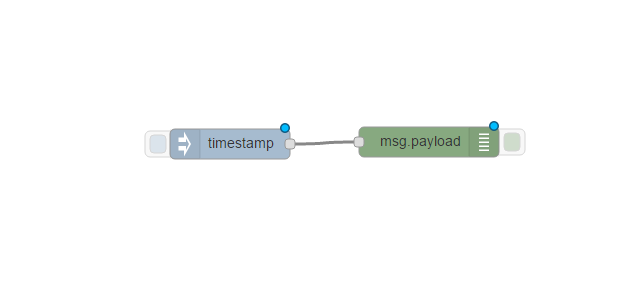
You can see these have now been connected. To test our workflow we can click on the button at the left-hand side of the inject node. This will push a timestamp into our workflow and the debug node will then output the message to the debug tab. Before we can use our workflow, we must first Deploy. We can do this by clicking the Deploy button at the top right of the page. You can see the message it has been successfully deployed;
And now if I click on the button on the left-hand side you can see a timestamp has been injected and if we look at the debug you can see the timestamp has been output;
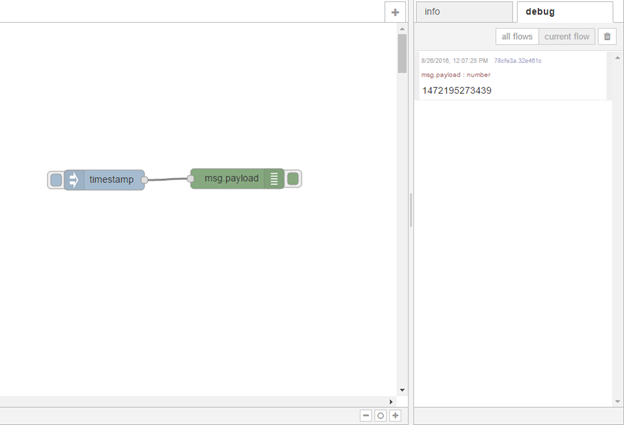
So the data has gone from the first node successfully into the debug node. Now that we have seen a very basic workflow let’s build upon this to create a workflow that will hopefully give you a better idea of the par and flexibility Node-RED can offer and why I feel it is such a great tool to use when trying out or experimenting with services or brainstorming or prototyping your ideas on Bluemix. The flow will allow us to capture information from Twitter, store it into a database, and make the results available for an HTTP request.
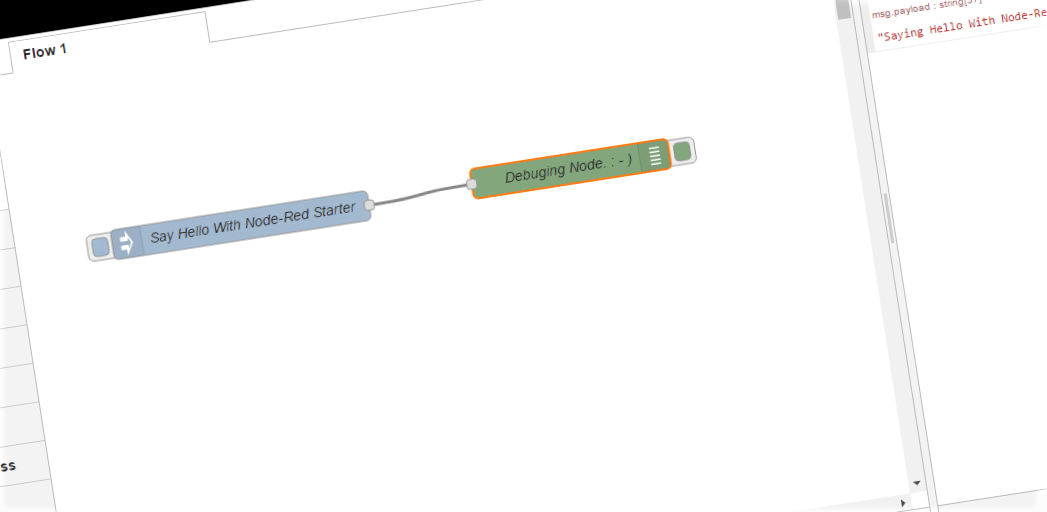
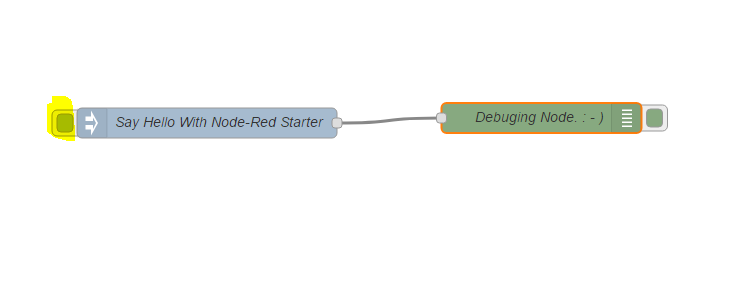
Now, let’s do integrate a small business logic and “Say Hello” in the debug;
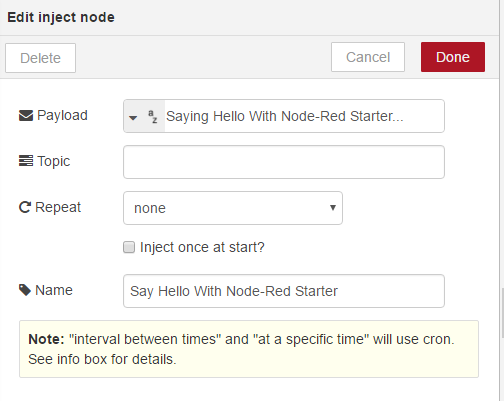
Double Click the Inject node, simply give the hello message as shown bellow;
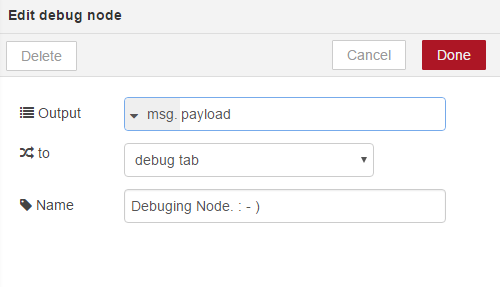
Now simply hit deploy and from the Inject node, hit the inject button;
And on the very next moment, you will see your message on the Debug window;
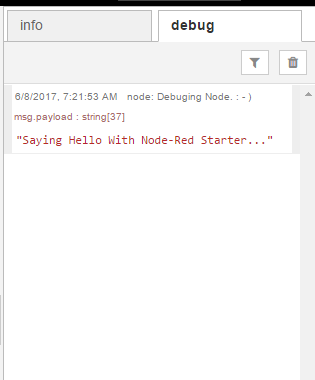
So you see, how easily we can play with this fantastic tool. : – )